Read your dashboard and reports
See how every store is doing, and which ones need help.
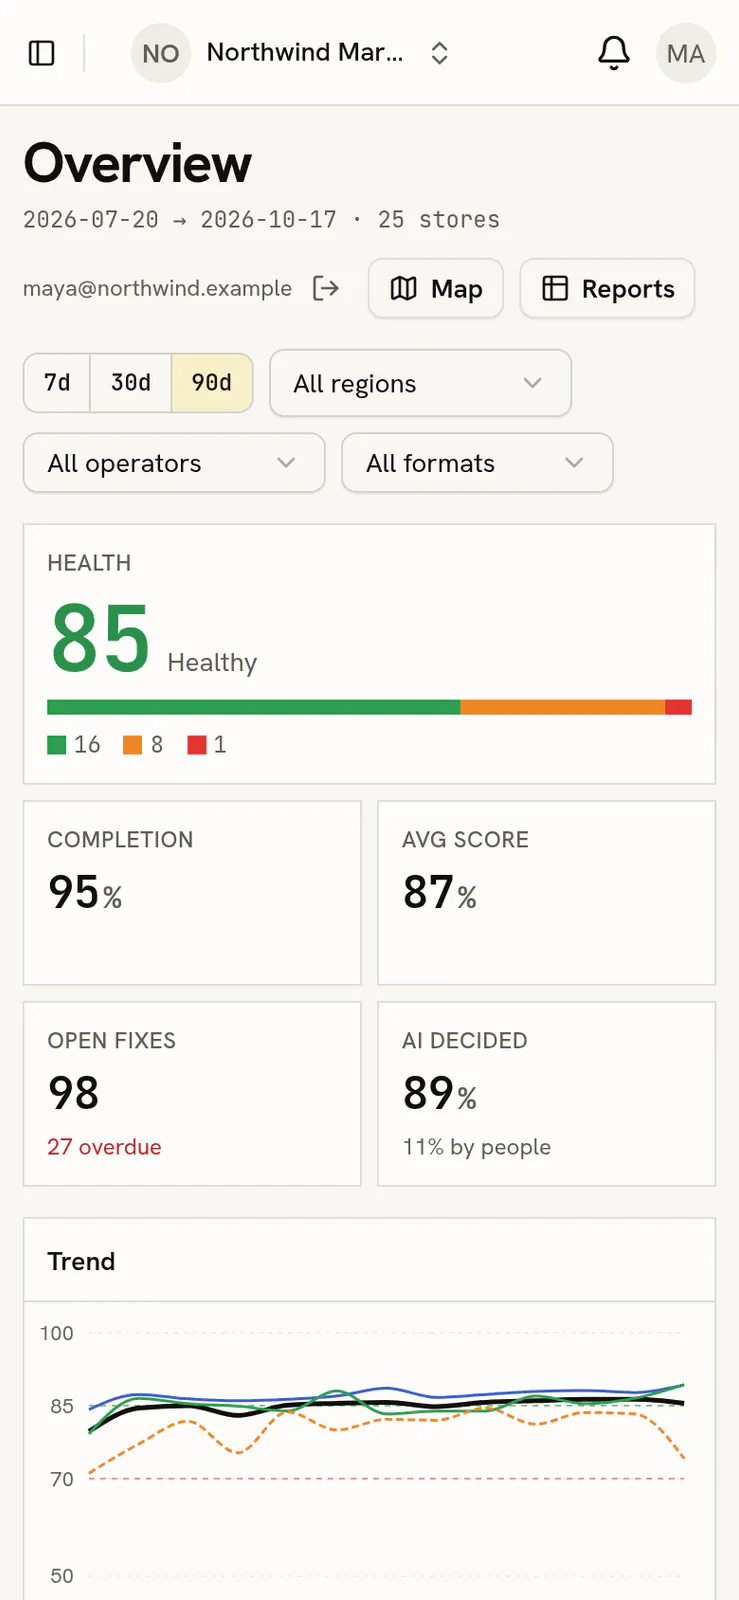
The Overview shows only the stores you look after.
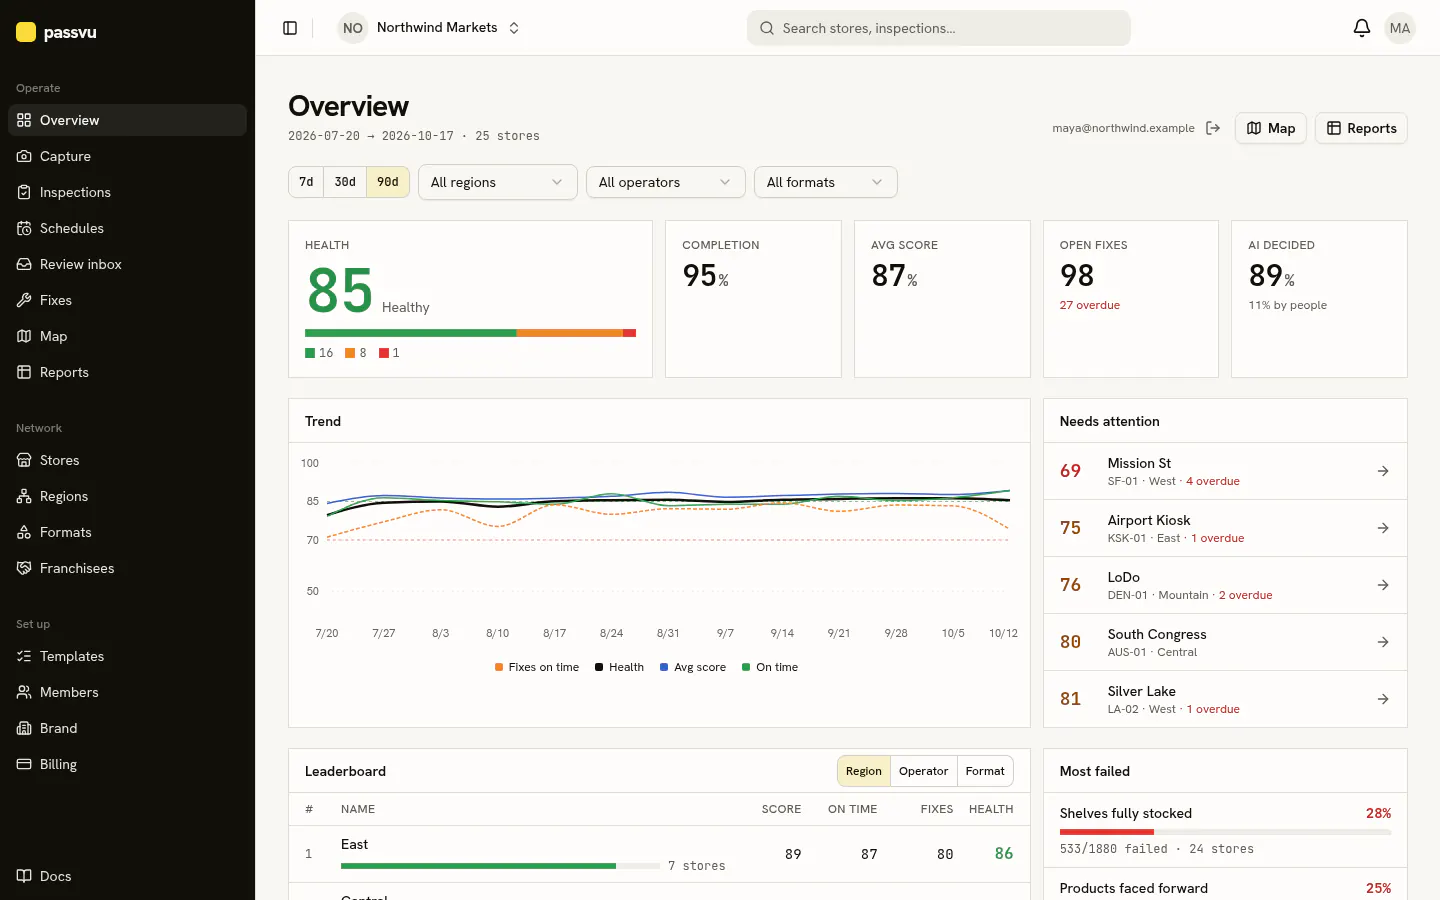
- 1Health of your stores
- 2Stores in green, amber and red
- 3Trend over time
- 4Stores that need attention
- 5Rankings by region, operator or store type
Health
Each store gets a health number from 0 to 100. It mixes three things:
- How well inspections scored (half of it)
- Fixes done on time
- Inspections done on time
| Colour | Health |
|---|---|
| Green | 85 and up |
| Amber | 70 to 84 |
| Red | Under 70 |
Map
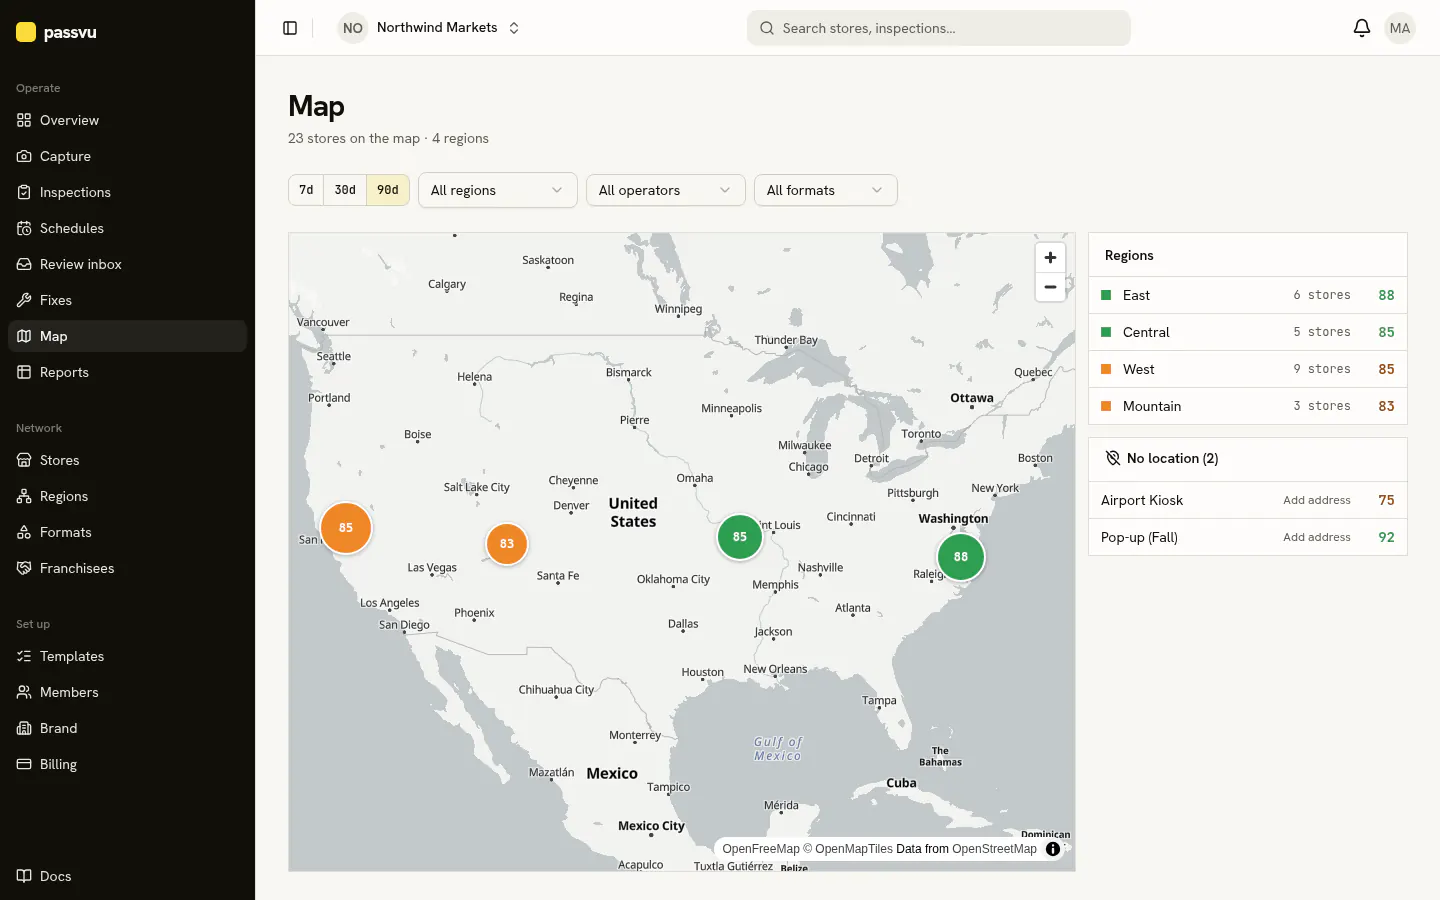
- 1Zoom in to see single stores
- 2Health of a region
- 3Stores with no address yet
One store over time
Open a store, then Performance, to see its weekly trend and weak areas.
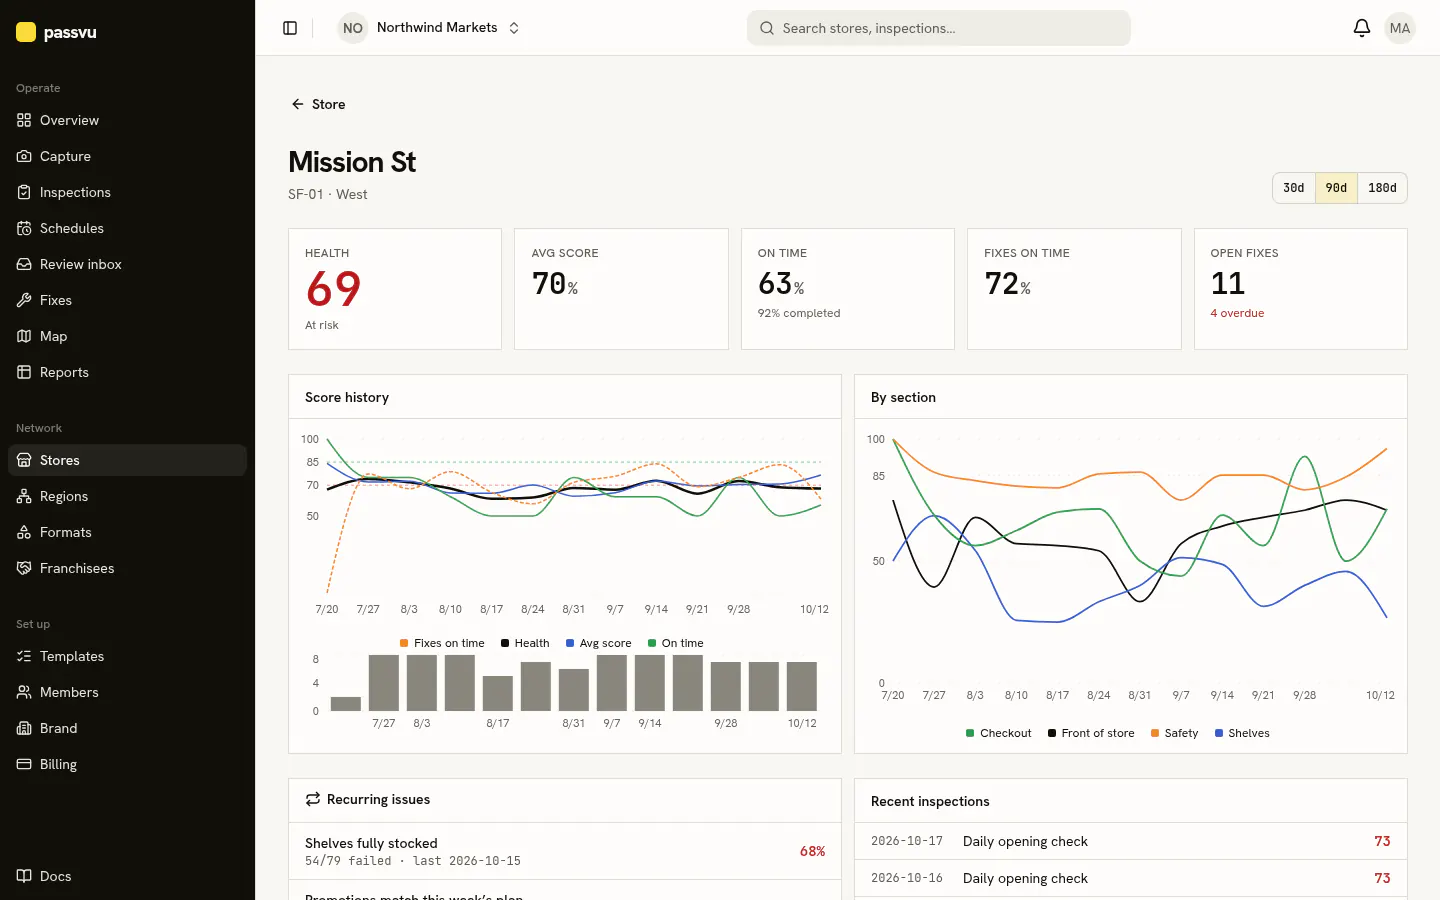
- 1Weekly score and health
- 2Score by area
Reports
Go to Reports. Filter by date, region, operator, store type or checklist. Download the list as a spreadsheet.
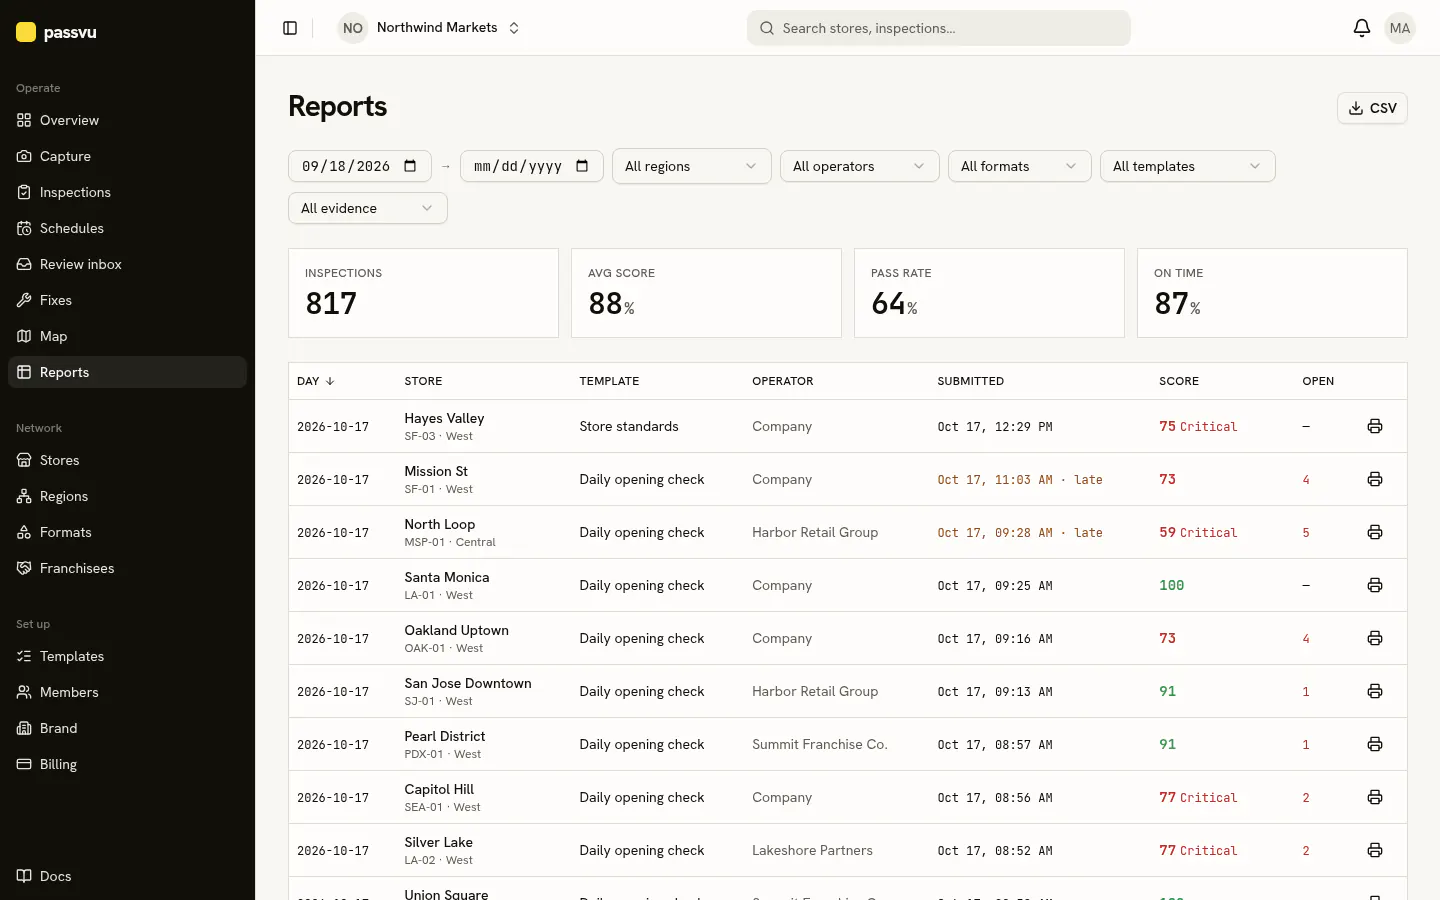
- 1Filters
- 2Totals
- 3Download as a spreadsheet
Photos uploaded later from a computer (not taken live) are marked unverified and don't count toward scores.
Last updated on